QC3|相関係数の計算方法・性質・使用上の注意点をわかりやすく解説 QC Level 3 | Correlation Coefficient: Calculation, Properties, and Key Cautions Explained
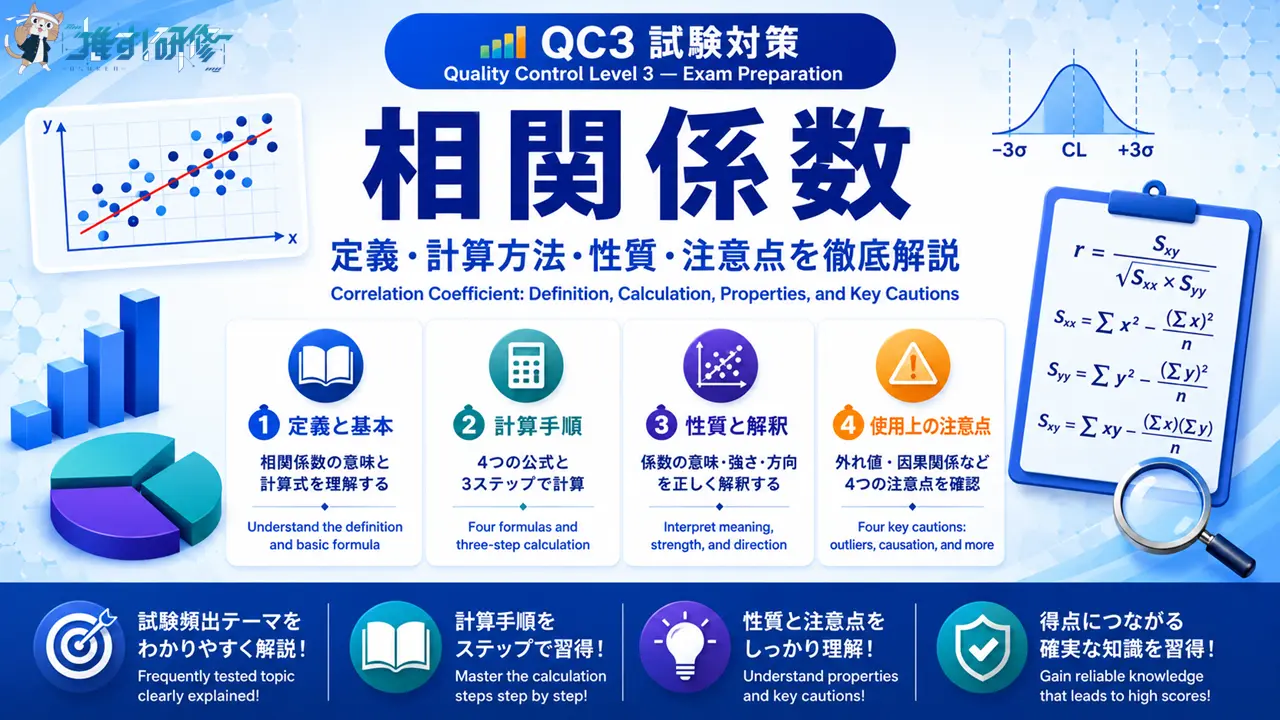
QC3の試験において、「相関係数」は散布図とセットで出題されることが多い重要テーマです。計算に必要な式は4つだけに絞られており、手順を正確に覚えれば確実に得点できる分野です。本記事では、相関係数の定義・計算方法・性質・散布図との関係・使用上の注意点まで、試験合格に必要な知識を体系的にわかりやすく解説します。
In the QC Level 3 exam, the correlation coefficient is an important topic that frequently appears alongside scatter diagrams. Only four formulas are needed for the calculations, and this is an area where you can reliably score points once you master the procedure. This article provides a clear, systematic explanation of everything you need for the exam: the definition of correlation coefficient, how to calculate it, its properties, its relationship to scatter diagrams, and the key points to keep in mind when using it.
目次
相関係数とは何か What Is the Correlation Coefficient?
相関係数とは、2つの変数(xとy)の間に直線的な相関関係があるかどうかを数値で表す指標です。「xが増えるとyも増える」あるいは「xが増えるとyは減る」といった2変数の関係の強さと方向を、ひとつの数値で示します。散布図が「目で見る」ツールであるのに対し、相関係数は「数値で確認する」ツールです。試験では、散布図のデータからxとyの値を読み取り、相関係数rを計算するパターンがよく出題されます。
The correlation coefficient is a numerical indicator that expresses whether a linear relationship exists between two variables (x and y). It represents, in a single number, both the strength and direction of the relationship between two variables — such as “as x increases, y also increases” or “as x increases, y decreases.” While a scatter diagram is a tool for seeing the relationship visually, the correlation coefficient is a tool for confirming it numerically. In the exam, a common question type involves reading x and y values from a scatter diagram and calculating the correlation coefficient r.
相関係数の計算方法 How to Calculate the Correlation Coefficient
覚えるべき4つの公式 The Four Formulas to Memorize
相関係数の計算に必要な公式は4つです。この4つを確実に覚えることが、相関係数の問題を解くための絶対条件です。
Four formulas are needed to calculate the correlation coefficient. Memorizing these four formulas is an absolute requirement for solving correlation coefficient questions.
| 公式 / Formula | 意味 / Meaning |
|---|---|
| r = S_xy ÷ √(S_xx × S_yy) | 相関係数 / Correlation coefficient |
| S_xx = x²の合計 − (xの合計)² ÷ n | xの偏差平方和 / Sum of squared deviations for x |
| S_yy = y²の合計 − (yの合計)² ÷ n | yの偏差平方和 / Sum of squared deviations for y |
| S_xy = (x×y)の合計 − (xの合計)×(yの合計) ÷ n | xとyの偏差積和 / Sum of cross-deviations for x and y |
S_xxとS_yyは偏差平方和(各データの値と平均値との差を2乗して足し合わせたもの)、S_xyは偏差積和(xの偏差とyの偏差を掛け合わせて足し合わせたもの)です。S_xxとS_yyは必ず0以上の値をとります。一方、S_xyは正・負・ゼロのいずれの値もとりうる点に注意してください。
S_xx and S_yy are sums of squared deviations (the sum of the squared differences between each data value and the mean), while S_xy is the sum of cross-deviations (the sum of the products of the x deviation and y deviation for each data point). S_xx and S_yy always take values of 0 or greater. Note, however, that S_xy can take positive, negative, or zero values.
計算の3ステップ The Three-Step Calculation Procedure
相関係数の計算は、以下の3つのステップで行います。
The correlation coefficient is calculated in the following three steps.
STEP 1:散布図からxとyの値を読み取り、計算補助表を作る
STEP 1: Read the x and y values from the scatter diagram and construct a calculation table
散布図の各点の座標(x, y)を読み取り、No.・x・y・x²・y²・x×yの6列で構成される計算補助表を作成します。各列の合計を求めておくと、次のステップの計算が大幅に楽になります。
Read the coordinates (x, y) of each point on the scatter diagram and construct a calculation table with six columns: No., x, y, x², y², and x×y. Summing each column makes the calculations in the next step much easier.
STEP 2:表をもとにS_xx・S_yy・S_xyを計算する
STEP 2: Use the table to calculate S_xx, S_yy, and S_xy
STEP 1で求めた各合計値を4つの公式に代入して、S_xx・S_yy・S_xyをそれぞれ計算します。計算補助表の合計行の値を使えば、公式への代入がスムーズに行えます。
Substitute the column totals from STEP 1 into the four formulas to calculate S_xx, S_yy, and S_xy. Using the values in the totals row of the calculation table allows smooth substitution into the formulas.
STEP 3:公式に代入して相関係数rを求める
STEP 3: Substitute into the formula to find the correlation coefficient r
STEP 2で求めたS_xx・S_yy・S_xyを r = S_xy ÷ √(S_xx × S_yy) に代入し、相関係数rを計算します。試験では小数第2位程度まで計算する問題が多く出題されます。
Substitute the S_xx, S_yy, and S_xy values from STEP 2 into r = S_xy ÷ √(S_xx × S_yy) to calculate the correlation coefficient r. Exam questions typically require calculation to approximately two decimal places.
計算例 Worked Example
以下の計算補助表をもとに、相関係数rを求めてみましょう(n = 6)。
Using the calculation table below, let’s find the correlation coefficient r (n = 6).
| No. | x | y | x² | y² | x×y |
|---|---|---|---|---|---|
| 1 | 2 | 10 | 4 | 100 | 20 |
| 2 | 4 | 14 | 16 | 196 | 56 |
| 3 | 6 | 12 | 36 | 144 | 72 |
| 4 | 8 | 18 | 64 | 324 | 144 |
| 5 | 10 | 16 | 100 | 256 | 160 |
| 6 | 12 | 20 | 144 | 400 | 240 |
| 合計 / Total | 42 | 90 | 364 | 1420 | 692 |
STEP 2の計算 / STEP 2 Calculations
S_xx = 364 − 42² ÷ 6 = 364 − 294 = 70
S_yy = 1420 − 90² ÷ 6 = 1420 − 1350 = 70
S_xy = 692 − 42 × 90 ÷ 6 = 692 − 630 = 62
STEP 3の計算 / STEP 3 Calculation
r = 62 ÷ √(70 × 70) = 62 ÷ √4900 = 62 ÷ 70 ≒ 0.89

相関係数の性質 Properties of the Correlation Coefficient
相関係数rには、試験で必ず問われる4つの重要な性質があります。
The correlation coefficient r has four important properties that are always tested in the exam.
| 性質 / Property | 内容 / Detail |
|---|---|
| ①取りうる値の範囲 Range of values | 相関係数は必ず −1 以上 +1 以下の値をとる(−1 ≦ r ≦ 1) The correlation coefficient always takes a value between −1 and +1 (−1 ≦ r ≦ 1) |
| ②+1に近い場合 When r is close to +1 | 正の相関が強い。xが増えるとyも増える関係。散布図の点が右上がりの直線に近く集まる Strong positive correlation. As x increases, y also increases. Points on the scatter diagram cluster close to an upward-sloping line |
| ③−1に近い場合 When r is close to −1 | 負の相関が強い。xが増えるとyは減る関係。散布図の点が右下がりの直線に近く集まる Strong negative correlation. As x increases, y decreases. Points on the scatter diagram cluster close to a downward-sloping line |
| ④0に近い場合 When r is close to 0 | 相関が弱い(または相関なし)。散布図の点が全体に散らばる Weak or no correlation. Points on the scatter diagram are scattered broadly |
重要ポイント / Key Point
相関係数は直線的な関係の程度を示す指標です。+1はすべての点が右上がりの直線上に、−1はすべての点が右下がりの直線上に打点されている状態を示します。また、r = 0は「直線的な相関がない」ことを意味しますが、曲線的な関係が存在する可能性は否定されません。
The correlation coefficient measures the degree of linear relationship. A value of +1 means all points lie exactly on an upward-sloping straight line; −1 means all points lie exactly on a downward-sloping straight line. Note that r = 0 means “no linear correlation” — it does not rule out the possibility of a curvilinear relationship.
相関係数を使う際の注意点 Important Points When Using the Correlation Coefficient
相関係数は非常に有用な指標ですが、正しく使うためにはいくつかの注意点があります。試験では、これらの注意点を理解しているかどうかを問う問題も出題されます。
The correlation coefficient is a highly useful indicator, but there are several important points to keep in mind when using it correctly. The exam also tests whether you understand these points.
①外れ値(異常値)への対応 Handling Outliers
散布図に外れ値が見られる場合は、必ずその原因を調査します。原因が転記ミスなどの測定誤差と判断された場合は、その外れ値を除外してから相関係数を計算します。外れ値が1〜2点含まれているだけでも相関係数の値は大きく変わるため、散布図を必ず描いて全体の分布を目で確認することが重要です。
When outliers are found in a scatter diagram, the cause must always be investigated. If the cause is determined to be a measurement error such as a transcription mistake, the outlier is removed before calculating the correlation coefficient. Because even one or two outliers can significantly change the value of the correlation coefficient, it is important to always draw a scatter diagram and visually check the overall distribution.
②層別の必要性 The Need for Stratification
全データをまとめて計算した相関係数と、データを層別(グループ分け)したうえで各グループの相関係数を求めた結果が大きく異なることがあります。たとえば、全体の相関係数がr ≒ 0.7であっても、機械Aと機械Bに層別すると、それぞれほぼ無相関(r ≒ 0)になるケースがあります。データに複数の要因が混在している場合は、層別を検討することが大切です。
The correlation coefficient calculated using all data together and the results obtained by stratifying (grouping) the data and calculating the correlation coefficient for each group can differ significantly. For example, even when the overall correlation coefficient is r ≈ 0.7, stratifying by Machine A and Machine B may reveal that each group shows almost no correlation (r ≈ 0). When multiple factors are mixed within the data, stratification should be considered.
③曲線的な関係への注意 Caution with Curvilinear Relationships
相関係数は直線的な関係の強さを示す指標であるため、データが曲線的な関係にある場合は相関係数を求めることに意味がありません。散布図を描いた際に放物線状や逆U字状などの曲線的なパターンが見られる場合は、相関係数の値だけで判断してはいけません。相関係数を求める前に、必ず散布図を描いて関係の形を確認する習慣が大切です。
Because the correlation coefficient measures the strength of a linear relationship, it is not meaningful to calculate the correlation coefficient when the data follows a curvilinear pattern. When a scatter diagram shows a parabolic, inverted-U, or other curved pattern, the value of the correlation coefficient alone should not be used to draw conclusions. It is essential to always draw a scatter diagram and confirm the shape of the relationship before calculating the correlation coefficient.
④相関と因果関係の違い The Difference Between Correlation and Causation
相関係数が高くても、それはxとyの間に「関連がある」ことを示すだけであり、「xがyの原因である」という因果関係を直接証明するものではありません。因果関係を確認するためには、技術的・専門的な知見にもとづいた考察が別途必要です。
Even when the correlation coefficient is high, it only indicates that there is an association between x and y — it does not directly prove a causal relationship in which x causes y. Confirming causation requires separate consideration based on technical and specialized knowledge.
試験直前チェック Key Points to Remember
- 相関係数の定義 2変数の相関関係の有無・強さ・方向を数値で示す指標。散布図とセットで出題されることが多い
Definition of correlation coefficient — A numerical indicator of the presence, strength, and direction of the relationship between two variables. Frequently appears alongside scatter diagrams in the exam - 4つの公式 r = S_xy ÷ √(S_xx × S_yy)、S_xx = x²合計 − (x合計)²÷n、S_yy = y²合計 − (y合計)²÷n、S_xy = (x×y)合計 − (x合計)×(y合計)÷n
Four formulas — r = S_xy ÷ √(S_xx × S_yy); S_xx = Σx² − (Σx)²÷n; S_yy = Σy² − (Σy)²÷n; S_xy = Σ(x×y) − (Σx×Σy)÷n - 計算の3ステップ ①散布図からx・yを読み取り計算補助表を作成→②S_xx・S_yy・S_xyを計算→③公式に代入してrを求める
Three calculation steps — ① Read x and y from the scatter diagram and build a calculation table → ② Calculate S_xx, S_yy, and S_xy → ③ Substitute into the formula to find r - 相関係数の範囲と意味 −1 ≦ r ≦ 1。+1に近いほど正の相関が強く、−1に近いほど負の相関が強い。0に近いほど相関が弱い
Range and meaning — −1 ≦ r ≦ 1. Closer to +1 = stronger positive correlation; closer to −1 = stronger negative correlation; closer to 0 = weaker correlation - S_xyに注意 S_xxとS_yyは0以上の値のみをとるが、S_xyは正・負・ゼロのいずれの値もとりうる
Note on S_xy — S_xx and S_yy take only non-negative values, but S_xy can be positive, negative, or zero - 使用上の4つの注意点 ①外れ値は原因調査後に除外判断②層別によって相関が異なることがある③曲線的な関係には相関係数は意味をなさない④相関係数は因果関係を証明しない
Four points of caution — ① Investigate outliers before deciding to exclude; ② stratification may reveal different correlations; ③ correlation coefficient is not meaningful for curvilinear relationships; ④ correlation does not prove causation
練習問題 相関係数の理解を確認しよう Practice Questions: Test Your Understanding of Correlation Coefficient
ここまで学んだ内容を確認するため、試験形式の練習問題に挑戦してみましょう。解答と解説は各問題の直下に記載しています。
To review what you have learned, try the following exam-style practice questions. The answer and explanation for each question are provided directly below it.
問題1 Question 1
相関係数rに関する次の記述のうち、誤っているものはどれか。
Which of the following statements about the correlation coefficient r is incorrect?
- 偏差平方和S_xxおよびS_yyは、必ず0以上の値をとる。
The sums of squared deviations S_xx and S_yy always take values of 0 or greater. - 偏差積和S_xyは、xの偏差とyの偏差の積の総和であり、正・負・ゼロのいずれの値もとりうる。
The sum of cross-deviations S_xy is the sum of the products of the x and y deviations, and can take positive, negative, or zero values. - 相関係数r = 0は、xとyの間にいかなる関係も存在しないことを証明する。
A correlation coefficient of r = 0 proves that no relationship of any kind exists between x and y. - 相関係数rの値は必ず −1 以上 +1 以下の範囲に収まる。
The value of the correlation coefficient r always falls within the range of −1 to +1 inclusive.
解答:3 Answer: 3
選択肢3が誤りです。r = 0は「直線的な相関が認められない」ことを意味しますが、xとyの間に曲線的な関係が存在する可能性まで否定するものではありません。たとえば、データが逆U字状や放物線状に分布している場合でも、相関係数が0に近い値をとることがあります。相関係数はあくまで直線的な関係の程度を示す指標であることを正確に理解しておく必要があります。選択肢1は正しい記述です。S_xxとS_yyは偏差(各データと平均値との差)を2乗して合計するため、必ず0以上の値をとります。選択肢2は正しい記述です。S_xyはxとyの偏差の積の和であり、関係の向きによって正・負・ゼロのいずれにもなります。選択肢4は正しい記述です。相関係数の値域は定義上 −1 ≦ r ≦ 1 に限定されます。
Option 3 is incorrect. A value of r = 0 means that no linear correlation is detected — it does not rule out the possibility of a curvilinear relationship between x and y. For example, data distributed in an inverted-U or parabolic pattern can still yield a correlation coefficient close to 0. It is important to understand that the correlation coefficient measures only the degree of linear relationship. Option 1 is correct: S_xx and S_yy sum squared deviations (which are always non-negative), so they always take values of 0 or greater. Option 2 is correct: S_xy is the sum of the products of the x and y deviations and can be positive, negative, or zero depending on the direction of the relationship. Option 4 is correct: by definition, the range of the correlation coefficient is limited to −1 ≦ r ≦ 1.
問題2 Question 2
対になったデータ(x, y)のn = 8のデータから相関係数rを求める。次の計算補助表の合計行から得られた値を用いたとき、相関係数rとして最も適切なものはどれか。
The correlation coefficient r is to be calculated from n = 8 paired data points (x, y). Using the values from the totals row of the calculation table below, which of the following is the most appropriate value for the correlation coefficient r?
| 合計 / Total | Σx | Σy | Σx² | Σy² | Σ(x×y) |
|---|---|---|---|---|---|
| 値 / Value | 8 | 24 | 28 | 92 | 42 |
- r ≒ −0.90
- r ≒ −0.45
- r ≒ 0.45
- r ≒ 0.90
解答:4 Answer: 4
3つの公式に合計値を代入して計算します。S_xx = 28 − 8² ÷ 8 = 28 − 8 = 20。S_yy = 92 − 24² ÷ 8 = 92 − 72 = 20。S_xy = 42 − 8 × 24 ÷ 8 = 42 − 24 = 18。相関係数 r = 18 ÷ √(20 × 20) = 18 ÷ √400 = 18 ÷ 20 = 0.90 となります。S_xxとS_yyがともに20で等しいため、√(20 × 20) = √400 = 20という計算がシンプルにまとまる点に注目してください。S_xyが正の値(+18)であることから、xとyの間に正の相関があることも確認できます。計算では①S_xx・S_yy・S_xyを順番に求める②公式に代入するという手順を確実に踏んでください。
Substitute the totals into the three formulas: S_xx = 28 − 8² ÷ 8 = 28 − 8 = 20. S_yy = 92 − 24² ÷ 8 = 92 − 72 = 20. S_xy = 42 − 8 × 24 ÷ 8 = 42 − 24 = 18. Therefore r = 18 ÷ √(20 × 20) = 18 ÷ √400 = 18 ÷ 20 = 0.90. Note that because S_xx and S_yy are both equal to 20, the denominator simplifies neatly to √400 = 20. The fact that S_xy is positive (+18) also confirms that x and y have a positive correlation. Follow these steps consistently: ① calculate S_xx, S_yy, and S_xy in order; ② substitute into the formula.
問題3 Question 3
相関係数の使用に関する次の記述のうち、正しいものはどれか。
Which of the following statements about the use of the correlation coefficient is correct?
- 外れ値が散布図に見られた場合は、原因にかかわらず直ちに除外してから相関係数を計算する。
When outliers are found in a scatter diagram, they should be removed immediately regardless of the cause before calculating the correlation coefficient. - 相関係数を計算する前に散布図を描き、外れ値の有無や関係の形(直線的か曲線的か)を目視で確認することが重要である。
It is important to draw a scatter diagram before calculating the correlation coefficient and visually confirm whether outliers are present and whether the relationship is linear or curvilinear. - 全データで計算した相関係数が高い値を示す場合、データを層別しても各層の相関係数は必ず同程度の高い値を示す。
When the correlation coefficient calculated using all data is high, stratifying the data will always produce similarly high correlation coefficients within each stratum. - 相関係数が+1に近い値を示す場合、xがyの原因であることが統計的に証明される。
When the correlation coefficient shows a value close to +1, it is statistically proven that x causes y.
解答:2 Answer: 2
選択肢2が正しい記述です。相関係数は直線的な関係の程度を示す指標であるため、外れ値や曲線的なパターンの存在を見落としたまま計算すると、結果が実態とかけ離れてしまいます。散布図を描いて関係の形を目視確認することは、相関係数を正しく活用するための基本的な手順です。選択肢1は誤りです。外れ値は原因を調査し、転記ミスなどの測定誤差と判断された場合にのみ除外します。原因不明のまま除外することは適切ではありません。選択肢3は誤りです。全体の相関係数が高くても、データを層別すると各層では相関が低くなる場合があります。逆に全体の相関係数が低くても、層別後に各層で高い相関が現れることもあります。選択肢4は誤りです。相関係数はxとyの間の「関連の有無と強さ」を示すものであり、因果関係の証明にはなりません。因果関係の確認には、技術的・専門的な考察が別途必要です。
Option 2 is correct. Because the correlation coefficient measures the degree of linear relationship, failing to check for outliers or curvilinear patterns before calculating can produce results that do not reflect the true nature of the data. Drawing a scatter diagram to visually confirm the shape of the relationship is a fundamental step in using the correlation coefficient appropriately. Option 1 is incorrect: outliers must first be investigated, and should only be excluded when they are determined to be the result of measurement error or a similar cause — removal without investigation is not appropriate. Option 3 is incorrect: even when the overall correlation coefficient is high, stratifying the data can result in lower correlations within each stratum; conversely, a low overall correlation can conceal high correlations within individual strata. Option 4 is incorrect: the correlation coefficient indicates the presence and strength of an association between x and y, not causation — confirming a causal relationship requires separate consideration based on technical and specialized knowledge.
- 新入社員フォローアップ研修とは? What Is New Employee Follow-Up Training? Purpose, Themes, and Design for HR Professionals
- ITパスポート試験|法務の基礎知識 IT Passport Exam | Legal Affairs: Fundamentals and Key Concepts
この記事を書いた人
関連記事
-
 QC3|品質の概念・QC的ものの見方・工程管理・小集団活動・QMSの基礎知識をわかりやすく解説 QC Level 3 | Quality Concepts, the QC Way of Thinking, Process Management, Small Group Activities, and QMS Explained
 -
QC3|プロセス保証・方針管理・日常管理の基礎知識をわかりやすく解説 QC Level 3 | Process Assurance, Policy Management, and Daily Management Explained
-
QC3|QCストーリー(問題解決型の8手順・課題達成型の9手順)の違いと使い分けをわかりやすく解説 QC Level 3 | QC Story: 8-Step Problem-Solving vs. 9-Step Task-Achievement Explained
-
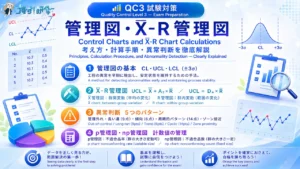
QC3|管理図の考え方とX̄-R管理図の計算方法をわかりやすく解説 QC Level 3 | Control Charts and X̄-R Chart Calculations Explained
-
QC3|工程能力指数 Cp・Cpkの計算方法と評価基準 QC Level 3 | Process Capability Index: Cp and Cpk Calculation and Evaluation Criteria
-
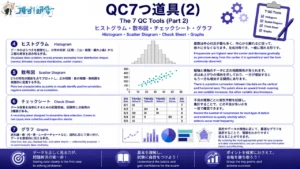
QC3|QC7つ道具(2) ヒストグラム・散布図・チェックシート・グラフの使い方 QC Level 3 | The 7 QC Tools (Part 2): How to Use Histograms, Scatter Diagrams, Check Sheets, and Graphs
-
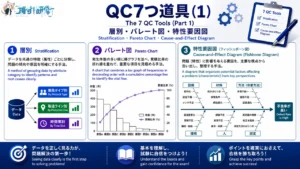
QC3|QC7つ道具(1)層別・パレート図・特性要因図の使い方 QC Level 3 | The 7 QC Tools (Part 1): How to Use Stratification, Pareto Charts, and Cause-and-Effect Diagrams
-
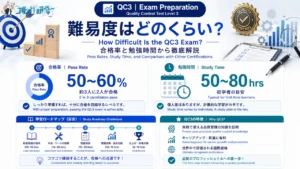
QC3の難易度は?合格率・勉強時間・他の資格との比較で徹底解説 How Difficult Is the QC3 Exam? Pass Rates, Study Time, and Comparison with Other Certifications