QC3|基本統計量の計算方法をわかりやすく解説 QC3 | Basic Statistical Measures Explained
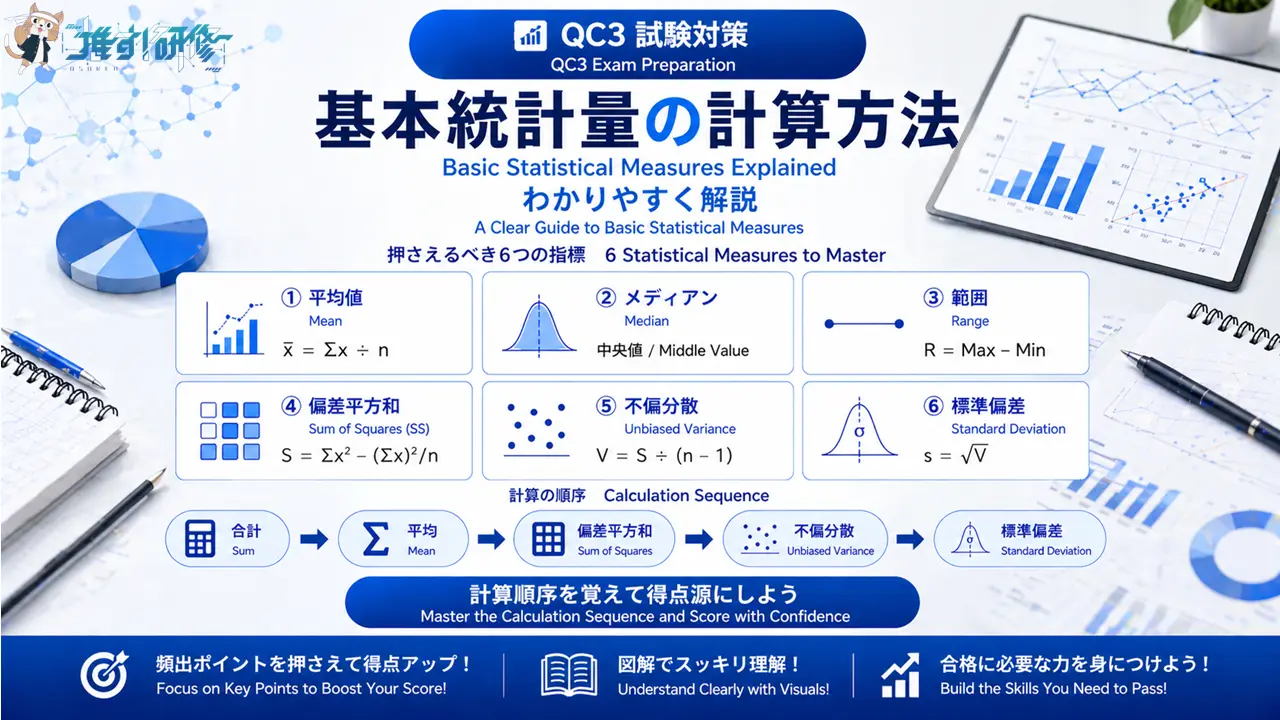
QC3の試験では、基本統計量の計算問題が頻繁に出題されます。平均値、メディアン、範囲、偏差平方和、不偏分散、標準偏差という6つの指標は、品質管理の基礎となる重要な概念です。
Questions involving the calculation of basic statistical measures appear frequently in the QC3 exam. The six statistical measures — mean, median, range, sum of squared deviations, unbiased variance, and standard deviation — are essential concepts that form the foundation of quality control.
本記事では、それぞれの基本統計量について、計算方法と意味をわかりやすく解説します。計算の順序を正しく理解することで、試験での得点力が大きく向上しますので、ぜひ参考にしてください。
This article explains how to calculate each measure and what it means, in a clear and accessible way. Understanding the correct order of calculation will significantly improve your exam performance, so please use this article as a reference.
目次
基本統計量とは?QC3で必ず押さえるべき6つの指標 What Are Basic Statistical Measures? | The 6 Indicators You Must Know for QC3
基本統計量とは、収集したデータの特徴を数値で表したものです。品質管理の現場では、製品の品質や工程の状態を把握するために、データを収集し分析します。そのとき、データ全体の傾向やばらつきを客観的に示すのが基本統計量の役割です。
Basic statistical measures are numerical values that describe the characteristics of collected data. In quality control settings, data is gathered and analyzed to understand product quality and the state of processes. The role of basic statistical measures is to objectively represent the overall trends and variability within that data.
基本統計量が品質管理で重要な理由 Why Basic Statistical Measures Matter in Quality Control
品質管理では「データに基づく判断」が基本となります。感覚や経験だけでなく、数値で現状を把握することで、問題の発見や改善の効果測定が可能になります。基本統計量を正しく理解し計算できることは、品質管理の第一歩といえます。
The foundation of quality control is “making decisions based on data.” By understanding the current situation through numbers rather than intuition or experience alone, it becomes possible to identify problems and measure the effectiveness of improvements. Being able to correctly understand and calculate basic statistical measures is the first step in quality control.
QC3では、基本統計量の計算問題が毎回出題されています。公式を覚えるだけでなく、それぞれの統計量が何を意味しているのかを理解することが、試験対策として重要です。
Calculation questions on basic statistical measures appear in every QC3 exam. For effective exam preparation, it is important not only to memorize the formulas but also to understand what each statistical measure actually means.
データの特徴を数値で表す意味 The Meaning of Expressing Data Characteristics as Numbers
データの特徴は、大きく分けて「中心の位置」と「ばらつきの程度」の2つの観点で表されます。中心の位置を表す指標が平均値やメディアンであり、ばらつきの程度を表す指標が範囲、分散、標準偏差です。
The characteristics of data can broadly be described from two perspectives: “central location” and “degree of variability.” Indicators that represent central location include the mean and median, while indicators that represent the degree of variability include range, variance, and standard deviation.
これらの指標を組み合わせることで、データ全体の姿を数値として把握できます。たとえば、平均値が同じでも標準偏差が異なれば、データの散らばり具合が違うことがわかります。
By combining these indicators, it is possible to understand the overall picture of a dataset in numerical terms. For example, even if two datasets have the same mean, a difference in standard deviation tells us that the degree of spread in the data is different.
平均値|データの中心を表す代表値 Mean | The Representative Value of a Dataset’s Center
平均値は、最も基本的な統計量であり、データの中心的な値を表します。すべてのデータを足し合わせ、データの個数で割ることで求められます。
The mean is the most fundamental statistical measure and represents the central value of a dataset. It is calculated by adding up all the data values and dividing by the number of data points.
平均値の計算方法 How to Calculate the Mean
平均値の計算式は以下のとおりです。
The formula for calculating the mean is as follows.
平均値 = xの合計 ÷ n
Mean = Sum of x ÷ n
ここで、xは個々のデータの値、nはデータの個数を表します。たとえば、5つのデータ「10、12、14、16、18」の平均値を求める場合、まず合計を計算します。10+12+14+16+18=70です。次に、データの個数5で割ります。70÷5=14となり、平均値は14です。
Here, x represents each individual data value and n represents the number of data points. For example, to find the mean of five data values — 10, 12, 14, 16, and 18 — first calculate the sum: 10 + 12 + 14 + 16 + 18 = 70. Then divide by the number of data points, 5: 70 ÷ 5 = 14. The mean is 14.
平均値を使う場面と注意点 When to Use the Mean and Key Cautions
平均値は、データの代表値として広く使われています。製品の寸法や重量の管理、工程の出来栄え評価など、さまざまな場面で活用されます。
The mean is widely used as a representative value for data. It is applied in a variety of contexts, including the management of product dimensions and weight, and the evaluation of process performance.
ただし、平均値には注意点があります。極端に大きい値や小さい値(外れ値)があると、平均値が大きく影響を受けてしまいます。このような場合には、メディアンを使う方が適切なこともあります。
However, there is an important caution to keep in mind. The mean is heavily influenced by extremely large or small values — known as outliers. In such cases, using the median may be more appropriate.

メディアン(中央値)|データの真ん中の値 Median | The Middle Value of a Dataset
メディアンとは、データを大きさ順に並び替えたときに、中央に位置する値のことです。日本語では「中央値」とも呼ばれます。
The median is the value that occupies the central position when data is arranged in order of size. In Japanese it is also referred to as 中央値 (chūō-chi).
メディアンの求め方 How to Find the Median
メディアンを求めるには、まずデータを小さい順(または大きい順)に並び替えます。データの個数が奇数の場合は、真ん中の値がメディアンとなります。データの個数が偶数の場合は、中央に近い2つの値を足して2で割った値がメディアンとなります。
To find the median, first arrange the data in ascending (or descending) order. When the number of data points is odd, the middle value is the median. When the number of data points is even, the median is calculated by adding the two middle values and dividing by 2.
たとえば、5つのデータ「12、18、10、16、14」のメディアンを求める場合、まず大きさ順に並び替えます。「10、12、14、16、18」となります。データの個数は5で奇数なので、真ん中の3番目の値である14がメディアンです。
For example, to find the median of five data values — 12, 18, 10, 16, and 14 — first arrange them in order: 10, 12, 14, 16, 18. Since there are 5 data points (an odd number), the middle value — the 3rd value, 14 — is the median.
6つのデータ「10、12、14、16、18、20」の場合は、中央に位置する値がありません。この場合、3番目の14と4番目の16を足して2で割ります。(14+16)÷2=15となり、メディアンは15です。
For six data values — 10, 12, 14, 16, 18, and 20 — there is no single middle value. In this case, add the 3rd value (14) and the 4th value (16) and divide by 2: (14 + 16) ÷ 2 = 15. The median is 15.
平均値とメディアンの使い分け When to Use the Mean vs. the Median
平均値とメディアンは、どちらもデータの中心を表す指標ですが、特徴が異なります。平均値はすべてのデータの値を反映しますが、外れ値の影響を受けやすい性質があります。一方、メディアンは外れ値の影響を受けにくく、データの分布が偏っている場合に有効です。
Both the mean and the median represent the center of a dataset, but they have different characteristics. The mean reflects all data values but is susceptible to the influence of outliers. The median, on the other hand, is resistant to outliers and is particularly useful when the data distribution is skewed.
試験では、平均値とメディアンの違いを問う問題も出題されます。それぞれの特徴を理解しておきましょう。
Exam questions may also test your understanding of the differences between the mean and the median. Make sure you understand the characteristics of each.
範囲|データのばらつきを簡単に把握する Range | A Simple Way to Grasp Data Variability
範囲は、データのばらつきを表す最も簡単な指標です。最大値と最小値の差を計算するだけで求められます。
Range is the simplest indicator of data variability. It is found simply by calculating the difference between the maximum and minimum values.
範囲の計算方法 How to Calculate the Range
範囲の計算式は以下のとおりです。
The formula for calculating the range is as follows.
範囲(R) = 最大値 - 最小値
Range (R) = Maximum value − Minimum value
たとえば、5つのデータ「10、12、14、16、18」の範囲を求める場合、最大値は18、最小値は10です。18-10=8となり、範囲は8です。
For example, for five data values — 10, 12, 14, 16, and 18 — the maximum is 18 and the minimum is 10. 18 − 10 = 8, so the range is 8.
範囲のメリットと限界 Advantages and Limitations of the Range
範囲のメリットは、計算が非常に簡単であることです。最大値と最小値さえわかれば、すぐに求められます。現場で素早くばらつきを把握したい場合に便利です。
The main advantage of the range is that it is extremely easy to calculate. As long as you know the maximum and minimum values, you can find it immediately. This makes it convenient for quickly assessing variability on the shop floor.
一方、範囲には限界もあります。範囲は最大値と最小値の2つの値だけで決まるため、それ以外のデータの分布状況を反映しません。また、外れ値があると範囲が大きくなり、実際のばらつきを正確に表さない場合があります。より正確にばらつきを把握するには、分散や標準偏差を使う必要があります。
On the other hand, the range has its limitations. Because it is determined solely by the maximum and minimum values, it does not reflect the distribution of the remaining data. In addition, the presence of outliers can inflate the range, making it an inaccurate representation of actual variability. For a more precise assessment of variability, variance or standard deviation should be used.
偏差平方和|ばらつきを計算するための基礎 Sum of Squared Deviations | The Foundation for Calculating Variability
偏差平方和は、分散や標準偏差を計算するための基礎となる値です。各データが平均値からどれだけ離れているかを数値化したものです。
The sum of squared deviations (also written as SS) is the foundational value used to calculate variance and standard deviation. It quantifies how far each data point is from the mean.
偏差平方和の計算方法 How to Calculate the Sum of Squared Deviations
偏差平方和の計算式は以下のとおりです。
The formula for calculating the sum of squared deviations is as follows.
偏差平方和(S) = x²の合計 -(xの合計)² ÷ n
Sum of Squared Deviations / SS (S) = Sum of x² − (Sum of x)² ÷ n
この式は、各データの二乗の合計から、データの合計の二乗をデータ数で割った値を引くことで求められます。この計算方法は、電卓で効率的に計算できるため、試験でもよく使われます。
This formula is applied by subtracting the square of the sum of all data values divided by the number of data points from the sum of each data value squared. This calculation method is well suited to efficient use of a calculator and is commonly used in exam settings.
たとえば、3つのデータ「2、4、6」の偏差平方和を求める場合、まずxの合計を計算します。2+4+6=12です。次にx²の合計を計算します。4+16+36=56です。偏差平方和は、56-(12)²÷3=56-144÷3=56-48=8となります。
For example, to find the sum of squared deviations for three data values — 2, 4, and 6 — first calculate the sum of x: 2 + 4 + 6 = 12. Then calculate the sum of x²: 4 + 16 + 36 = 56. The sum of squared deviations is: 56 − (12)² ÷ 3 = 56 − 144 ÷ 3 = 56 − 48 = 8.
なぜ偏差を二乗するのか Why Are Deviations Squared?
偏差とは、各データと平均値の差のことです。偏差をそのまま合計すると、プラスとマイナスが打ち消し合って0になってしまいます。そこで、偏差を二乗することで、すべての値をプラスにしてから合計します。これにより、ばらつきの大きさを正しく捉えることができます。
A deviation is the difference between each data value and the mean. If deviations are summed as they are, positive and negative values cancel each other out, resulting in zero. By squaring each deviation first, all values become positive before they are summed. This allows the magnitude of variability to be captured accurately.
不偏分散|サンプルから母集団のばらつきを推定する Unbiased Variance | Estimating Population Variability from a Sample
不偏分散は、サンプルデータから母集団のばらつきを推定するための指標です。偏差平方和をデータ数から1を引いた値で割って求めます。
Unbiased variance is an indicator used to estimate the variability of a population from sample data. It is calculated by dividing the sum of squared deviations by the number of data points minus 1.
不偏分散の計算方法 How to Calculate Unbiased Variance
不偏分散の計算式は以下のとおりです。
The formula for calculating unbiased variance is as follows.
不偏分散(V) = S ÷(n - 1)
Unbiased Variance (V) = S ÷ (n − 1)
ここで、Sは偏差平方和、nはデータの個数です。先ほどの例で偏差平方和が8、データ数が3の場合、不偏分散は8÷(3-1)=8÷2=4となります。
Here, S is the sum of squared deviations and n is the number of data points. Using the previous example where the sum of squared deviations is 8 and the number of data points is 3, the unbiased variance is: 8 ÷ (3 − 1) = 8 ÷ 2 = 4.
なぜn-1で割るのか Why Divide by n−1?
分散を計算するとき、なぜnではなくn-1で割るのでしょうか。これは、サンプルから母集団の分散を推定する際の偏りを補正するためです。
Why divide by n−1 rather than n when calculating variance? This is done to correct for the bias that arises when estimating the population variance from a sample.
サンプルの平均値は母集団の平均値とは異なる場合があります。サンプルの平均値を基準に偏差を計算すると、ばらつきが小さめに見積もられる傾向があります。n-1で割ることで、この偏りを補正し、母集団の分散をより正確に推定できます。n-1のことを「自由度」と呼びます。
The sample mean may differ from the population mean. When deviations are calculated based on the sample mean, variability tends to be underestimated. Dividing by n−1 corrects for this bias and allows a more accurate estimate of the population variance. The value n−1 is referred to as the “degrees of freedom.”
試験では「なぜn-1で割るのか」という理由を問う問題も出題されることがあります。「母集団の分散を偏りなく推定するため」と覚えておきましょう。
Exam questions may ask for the reason why division is by n−1. Remember the answer: “to estimate the population variance without bias.”
標準偏差|ばらつきを元の単位で表す Standard Deviation | Expressing Variability in the Original Units
標準偏差は、分散の平方根をとった値です。ばらつきを元のデータと同じ単位で表すことができるため、実務で最もよく使われる指標です。
Standard deviation is the square root of the variance. Because it expresses variability in the same units as the original data, it is the most widely used indicator in practical quality control work.
標準偏差の計算方法 How to Calculate Standard Deviation
標準偏差の計算式は以下のとおりです。
The formula for calculating standard deviation is as follows.
標準偏差(s) = √V = √(S ÷(n - 1))
Standard Deviation (s) = √V = √(S ÷ (n − 1))
先ほどの例で不偏分散が4の場合、標準偏差は√4=2となります。
Using the previous example where the unbiased variance is 4, the standard deviation is √4 = 2.
標準偏差を求めるには、まず偏差平方和を計算し、次に不偏分散を計算し、最後に平方根をとるという順序で計算します。この順序を覚えておくことが重要です。
To find the standard deviation, follow this sequence: first calculate the sum of squared deviations, then calculate the unbiased variance, and finally take the square root. Remembering this order is essential.
標準偏差の実務での活用 Practical Applications of Standard Deviation
標準偏差は、品質管理のさまざまな場面で活用されます。工程能力指数の計算、管理図の管理限界線の設定、製品のばらつき評価など、多くの分析で標準偏差が使われます。
Standard deviation is used in a wide range of quality control applications, including the calculation of process capability indices, the setting of control limits on control charts, and the evaluation of product variability.
分散は単位が二乗されているため(たとえばmm²)、直感的に理解しにくい場合があります。標準偏差は元の単位(たとえばmm)で表されるため、実際のばらつきをイメージしやすいというメリットがあります。
Because variance is expressed in squared units (for example, mm²), it can be difficult to interpret intuitively. Standard deviation is expressed in the original units (for example, mm), making it much easier to visualize actual variability — a significant practical advantage.
試験で狙われるポイント|計算の順序を押さえる Key Exam Topics | Master the Order of Calculation
基本統計量の計算問題では、計算の順序を正しく理解していることが重要です。順序を間違えると正しい答えにたどり着けません。
In calculation questions on basic statistical measures, understanding the correct order of calculation is essential. Getting the order wrong will prevent you from reaching the correct answer.
基本統計量の計算順序 The Correct Order for Calculating Basic Statistical Measures
基本統計量は、以下の順序で計算します。この順序を覚えておきましょう。
Basic statistical measures are calculated in the following sequence. Make sure to commit this order to memory.
まず、データの合計(xの合計)とデータの二乗の合計(x²の合計)を求めます。次に、平均値を計算します。平均値=xの合計÷nです。続いて、偏差平方和を計算します。偏差平方和=x²の合計-(xの合計)²÷nです。そして、不偏分散を計算します。不偏分散=偏差平方和÷(n-1)です。最後に、標準偏差を計算します。標準偏差=√不偏分散です。
First, find the sum of all data values (sum of x) and the sum of each value squared (sum of x²). Next, calculate the mean: Mean = Sum of x ÷ n. Then calculate the sum of squared deviations: S = Sum of x² − (Sum of x)² ÷ n. After that, calculate the unbiased variance: V = S ÷ (n − 1). Finally, calculate the standard deviation: s = √V.
この順序を「合計→平均→偏差平方和→分散→標準偏差」と覚えておくと、計算問題をスムーズに解くことができます。
Remembering this sequence as “Sum → Mean → Sum of Squared Deviations → Variance → Standard Deviation” will allow you to work through calculation questions smoothly.
CBT試験での電卓の使い方 Using the Calculator in the CBT Exam
QC3はCBT方式(コンピュータを使った試験)で実施されており、電卓の持ち込みは認められていません。試験では、テストセンターのパソコンに搭載されている電卓機能を使用します。
QC3 is administered in CBT format (computer-based testing), and personal calculators are not permitted. During the exam, you will use the calculator function built into the test center computer.
パソコンの電卓は、普段使い慣れた電卓とは操作感が異なる場合があります。特に偏差平方和の計算では、x²の合計を求める際にメモリ機能を活用すると便利です。各データを二乗した値をメモリに加算していき、最後にメモリの値を呼び出すことで、x²の合計を効率的に求められます。
The computer calculator may feel different from the handheld calculators you are used to. When calculating the sum of squared deviations in particular, using the memory function to accumulate the squared values one by one and then recalling the total can make finding the sum of x² much more efficient.
試験前に、Windowsの電卓アプリなどで操作方法を確認し、計算練習をしておくことをおすすめします。CBT試験では時間配分も重要ですので、電卓操作に慣れておくことで、計算ミスを減らし、解答時間を短縮できます。
Before the exam, it is strongly recommended to practice with a computer calculator application such as the Windows Calculator to familiarize yourself with its operation. Time management is important in CBT exams, so becoming comfortable with the calculator will help you reduce calculation errors and shorten your response time.
まとめ|基本統計量を得点源にしよう Summary | Make Basic Statistical Measures Your Scoring Strength
本記事では、QC3で出題される基本統計量について解説しました。最後に、試験対策として押さえておきたいポイントを整理します。
This article has explained the basic statistical measures that appear in the QC3 exam. Finally, let us organize the key points to keep in mind for exam preparation.
基本統計量は、平均値、メディアン、範囲、偏差平方和、不偏分散、標準偏差の6つです。平均値とメディアンはデータの中心を表し、範囲、分散、標準偏差はデータのばらつきを表します。
There are six basic statistical measures: mean, median, range, sum of squared deviations, unbiased variance, and standard deviation. The mean and median represent the center of the data, while range, variance, and standard deviation represent the variability of the data.
計算の順序は「合計→平均→偏差平方和→分散→標準偏差」です。この順序を覚えておけば、計算問題をスムーズに解くことができます。特に、偏差平方和の計算式「x²の合計-(xの合計)²÷n」と、不偏分散でn-1で割る理由は、試験で頻出のポイントです。
The order of calculation is “Sum → Mean → Sum of Squared Deviations → Variance → Standard Deviation.” Remembering this order will allow you to work through calculation questions smoothly. In particular, the formula for the sum of squared deviations — “Sum of x² − (Sum of x)² ÷ n” — and the reason for dividing by n−1 in unbiased variance are both frequently tested points in the exam.
CBT試験ではテストセンターのパソコン電卓を使用するため、事前にパソコンの電卓操作に慣れておくことも大切です。基本統計量の計算問題は、正しく理解すれば確実に得点できる分野です。本記事の内容を復習し、計算練習を重ねて、試験本番に備えてください。
Since the CBT exam uses the test center computer calculator, it is also important to familiarize yourself with computer calculator operation in advance. Calculation questions on basic statistical measures are a topic where correct understanding leads directly to reliable scores. Review the content of this article, build your calculation skills through practice, and prepare thoroughly for the exam.
練習問題 基本統計量の計算を確認しよう Practice Questions: Check Your Understanding of Basic Statistical Measures
ここまで学んだ内容を確認するため、試験形式の練習問題に挑戦してみましょう。解答は各問題の下に記載しています。
To check your understanding of what you have learned, let us try some practice questions in exam format. Answers are provided below each question.
問題1 Question 1
次の5つのデータの平均値とメディアンを求めたとき、正しい組み合わせはどれか。
Which of the following is the correct combination of mean and median for the five data values below?
データ:6、10、8、4、12 / Data: 6, 10, 8, 4, 12
- 平均値:8 メディアン:8 / Mean: 8 Median: 8
- 平均値:8 メディアン:10 / Mean: 8 Median: 10
- 平均値:10 メディアン:8 / Mean: 10 Median: 8
- 平均値:10 メディアン:10 / Mean: 10 Median: 10
解答:1 / Answer: 1
平均値はデータの合計をデータ数で割って求めます。6+10+8+4+12=40、40÷5=8です。メディアンはデータを小さい順に並べ替えると「4、6、8、10、12」となり、データ数は5(奇数)なので、真ん中の3番目の値である8がメディアンです。平均値とメディアンがともに8となります。
The mean is found by dividing the sum of the data by the number of data points: 6 + 10 + 8 + 4 + 12 = 40, and 40 ÷ 5 = 8. To find the median, arrange the data in ascending order: 4, 6, 8, 10, 12. Since there are 5 data points (an odd number), the middle value — the 3rd value, 8 — is the median. Both the mean and the median are 8.
問題2 Question 2
次の4つのデータの偏差平方和として、正しいものはどれか。
Which of the following is the correct sum of squared deviations for the four data values below?
データ:2、4、6、8 / Data: 2, 4, 6, 8
- 10
- 20
- 40
- 80
解答:2 / Answer: 2
偏差平方和の公式「x²の合計-(xの合計)²÷n」を使います。xの合計は2+4+6+8=20です。x²の合計は4+16+36+64=120です。偏差平方和=120-(20)²÷4=120-400÷4=120-100=20となります。計算の順序「合計→x²の合計→偏差平方和」をしっかり守ることがポイントです。
Apply the formula for the sum of squared deviations: Sum of x² − (Sum of x)² ÷ n. The sum of x is: 2 + 4 + 6 + 8 = 20. The sum of x² is: 4 + 16 + 36 + 64 = 120. Sum of squared deviations = 120 − (20)² ÷ 4 = 120 − 400 ÷ 4 = 120 − 100 = 20. The key is to strictly follow the calculation sequence: “Sum → Sum of x² → Sum of Squared Deviations.”
問題3 Question 3
不偏分散と標準偏差に関する次の記述のうち、正しいものはどれか。
Which of the following statements regarding unbiased variance and standard deviation is correct?
- 不偏分散は、偏差平方和をデータ数nで割って求める。 / Unbiased variance is calculated by dividing the sum of squared deviations by the number of data points n.
- 標準偏差は、不偏分散を2乗して求める。 / Standard deviation is calculated by squaring the unbiased variance.
- 不偏分散をn-1で割る理由は、母集団の分散を偏りなく推定するためである。 / The reason for dividing unbiased variance by n−1 is to estimate the population variance without bias.
- 不偏分散は、偏差平方和をn-1で割って求める。 / Unbiased variance is calculated by dividing the sum of squared deviations by n−1.
解答:4 / Answer: 4
不偏分散は「偏差平方和÷(n-1)」で求めます。選択肢1はnで割るとしており誤りです(正しくはn-1)。選択肢2は標準偏差の説明が逆で、標準偏差は不偏分散の平方根(√V)で求めます。選択肢3はn-1で割る理由の説明として「不偏分散をn-1で割る」となっており意味をなしていません。選択肢4が正しい計算方法です。なお、n-1を「自由度」と呼ぶことも覚えておきましょう。
Unbiased variance is calculated as: Sum of Squared Deviations ÷ (n − 1). Option 1 states division by n, which is incorrect (the correct divisor is n − 1). Option 2 has the relationship between standard deviation and variance reversed — standard deviation is the square root of unbiased variance (√V), not the square of it. Option 3 is grammatically incoherent as a reason for dividing by n − 1. Option 4 correctly states the calculation method. Also remember that n − 1 is referred to as the “degrees of freedom.”
- 研修後のフォローアップ完全ガイド|効果を最大化する6つの施策とチェックリスト The Complete Guide to Post-Training Follow-Up | 6 Initiatives and a Checklist to Maximize Training Effectiveness
- 危険物乙4|指定数量の覚え方と一覧表 Class B, Group 4 Hazardous Materials Engineer | Designated Quantities: Reference Table & Memorization Guide
この記事を書いた人
関連記事
-
 QC3|品質の概念・QC的ものの見方・工程管理・小集団活動・QMSの基礎知識をわかりやすく解説 QC Level 3 | Quality Concepts, the QC Way of Thinking, Process Management, Small Group Activities, and QMS Explained
 -
QC3|プロセス保証・方針管理・日常管理の基礎知識をわかりやすく解説 QC Level 3 | Process Assurance, Policy Management, and Daily Management Explained
-
QC3|QCストーリー(問題解決型の8手順・課題達成型の9手順)の違いと使い分けをわかりやすく解説 QC Level 3 | QC Story: 8-Step Problem-Solving vs. 9-Step Task-Achievement Explained
-
QC3|相関係数の計算方法・性質・使用上の注意点をわかりやすく解説 QC Level 3 | Correlation Coefficient: Calculation, Properties, and Key Cautions Explained
-
QC3|管理図の考え方とX̄-R管理図の計算方法をわかりやすく解説 QC Level 3 | Control Charts and X̄-R Chart Calculations Explained
-
QC3|工程能力指数 Cp・Cpkの計算方法と評価基準 QC Level 3 | Process Capability Index: Cp and Cpk Calculation and Evaluation Criteria
-
QC3|QC7つ道具(2) ヒストグラム・散布図・チェックシート・グラフの使い方 QC Level 3 | The 7 QC Tools (Part 2): How to Use Histograms, Scatter Diagrams, Check Sheets, and Graphs
-
QC3|QC7つ道具(1)層別・パレート図・特性要因図の使い方 QC Level 3 | The 7 QC Tools (Part 1): How to Use Stratification, Pareto Charts, and Cause-and-Effect Diagrams