QC3|データの種類とサンプリングをわかりやすく解説 QC Level 3 | Types of Data and Sampling Methods Explained
QC3の試験では、品質管理の基礎となる「データ」についての理解が問われます。データにはどのような種類があるのか、そしてデータを集める際に欠かせない「サンプリング」とは何か。これらは試験で繰り返し出題される重要テーマです。
The QC Level 3 exam tests your understanding of “data” — the foundation of quality control. What types of data exist, and what is “sampling,” the essential process for collecting data? These are important themes that appear repeatedly on the exam.
本記事では、データの種類から始まり、サンプリングの方法、そして誤差の考え方まで、初学者の方にもわかりやすく解説していきます。図解を交えながら丁寧に説明しますので、試験対策の第一歩としてぜひ参考にしてください。
This article provides a clear, beginner-friendly explanation covering types of data, sampling methods, and the concept of error. With diagrams to support understanding, this is the ideal starting point for your exam preparation.
目次
QC3で問われる「データの種類」とは? What Are the “Types of Data” Tested in QC Level 3?
品質管理の現場では、製品やサービスの状態を把握するためにデータを活用します。このデータを正しく理解し、適切に扱うことが品質向上の第一歩となります。QC3では、データの分類方法が基本知識として出題されるため、しっかりと押さえておきましょう。
In quality control settings, data is used to understand the condition of products and services. Correctly understanding and appropriately handling this data is the first step toward quality improvement. In QC Level 3, the classification of data is tested as fundamental knowledge, so make sure you have a solid grasp of it.
データは「数値データ」と「言語データ」に分かれる Data Is Divided into “Quantitative Data” and “Qualitative Data”
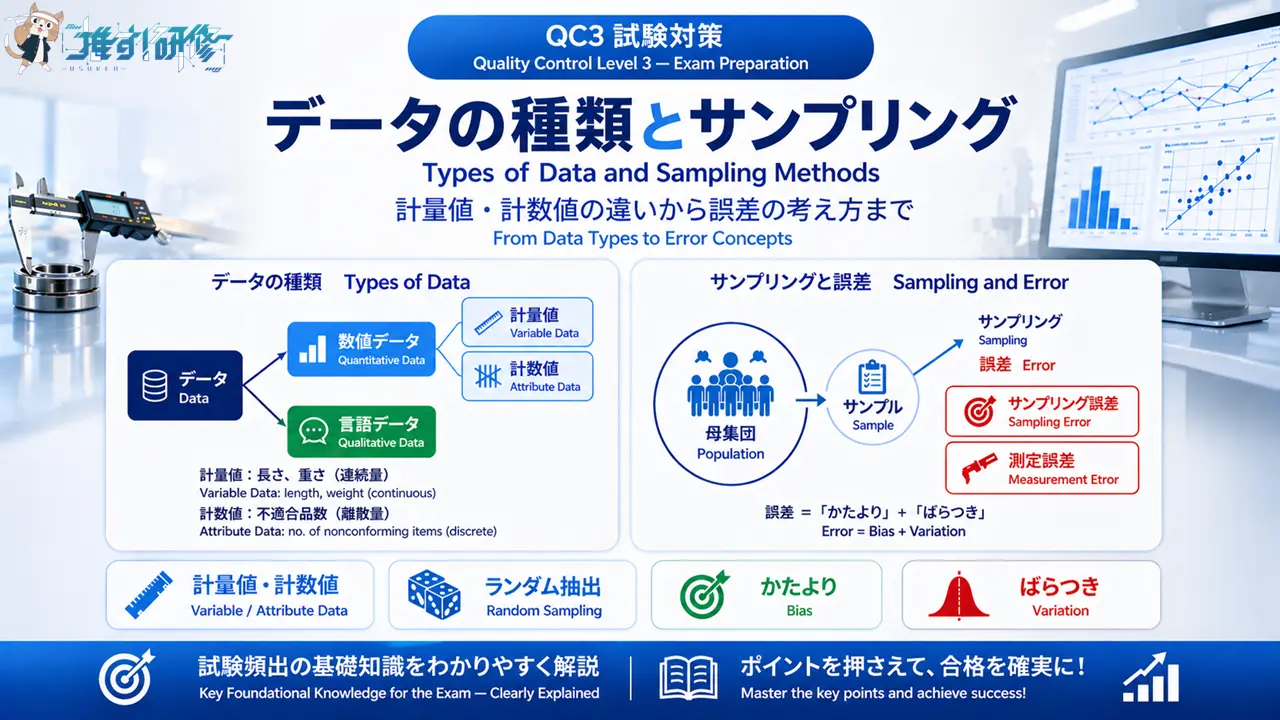
品質管理で扱うデータは、大きく「数値データ」と「言語データ」の2種類に分けることができます。数値データとは、その名のとおり数値で表現されるデータのこと。製品の長さや重さ、不良品の個数などが該当します。一方、言語データとは言葉で表現されるデータを指します。お客様からのクレーム内容や、作業者の意見といった情報がこれにあたります。
Data handled in quality control can be broadly divided into two types: “quantitative data” and “qualitative data.” Quantitative data, as the name suggests, is data expressed in numerical form — such as the length or weight of a product, or the number of defective items. Qualitative data, on the other hand, refers to data expressed in words, such as the content of customer complaints or the opinions of workers.
試験では「このデータは数値データか言語データか」を判断させる問題が出ることがあります。数字が含まれていれば数値データ、文章や単語で表現されていれば言語データ、という基本的な区別を覚えておくとよいでしょう。
The exam may ask you to determine whether a given piece of data is quantitative or qualitative. A useful rule of thumb: if it involves numbers, it is quantitative data; if it is expressed in sentences or words, it is qualitative data.
数値データの2つの分類|計量値と計数値の違い Two Classifications of Quantitative Data | The Difference Between Variable Data and Attribute Data
数値データは、さらに「計量値」と「計数値」の2つに分類されます。この違いは試験で頻繁に問われるポイントなので、確実に理解しておく必要があります。
Quantitative data is further classified into two types: “variable data” (計量値) and “attribute data” (計数値). This distinction is a frequently tested point on the exam, so make sure you understand it thoroughly.
計量値とは、長さや重さなどのように連続的に変化する値のこと。アナログ時計の針のように、途切れることなく滑らかに変化するイメージです。たとえば、製品の寸法が10.5mmから10.6mmへと変わるとき、その間には10.51mm、10.52mmといった無数の値が存在します。測定機器を使って計測することで得られるデータが計量値にあたります。
Variable data refers to values that change continuously, such as length or weight. Think of the hands of an analog clock — they move smoothly without interruption. For example, when a product’s dimension changes from 10.5 mm to 10.6 mm, there are countless values in between, such as 10.51 mm and 10.52 mm. Data obtained by measuring with instruments is variable data.
一方、計数値とは、1つ、2つと数え上げる値のこと。デジタル時計の表示のように、とびとびの値で変化するイメージです。不適合品の個数や欠点の数など、「何個あるか」を数えて得られるデータが計数値となります。計数値には小数点以下の値は存在せず、必ず整数で表されるのが特徴です。
Attribute data, on the other hand, refers to values obtained by counting — one, two, three, and so on. Think of a digital clock display, which changes in discrete steps. Data obtained by counting “how many” — such as the number of nonconforming items or the number of defects — is attribute data. Attribute data has no decimal values and is always expressed as a whole number.
データの変換を覚えておくと応用が利く Understanding Data Conversion Expands Your Practical Knowledge
データは、必要に応じて変換することも可能です。たとえば、60秒を1分に変換するように、単位を変えることでデータの活用範囲が広がります。また、計量値として測定したデータを、ある基準で区切って「合格 不合格」のように計数値的に扱うこともできます。
Data can also be converted as needed. Just as 60 seconds can be converted into 1 minute, changing the unit of measurement broadens the range of ways data can be used. It is also possible to take data originally measured as variable data and treat it like attribute data by applying a threshold — for example, classifying items as “pass” or “fail.”
このようなデータの変換は、現場での品質管理において頻繁に行われる作業です。試験でも「データをどのように変換するか」という観点から出題されることがあるため、柔軟な考え方を身につけておくと役立ちます。
This kind of data conversion is a task that occurs frequently in real-world quality control settings. Since exam questions may also be asked from the perspective of “how data is converted,” developing a flexible way of thinking will serve you well.
サンプリングの基本|母集団とサンプルの関係を理解しよう Sampling Basics | Understanding the Relationship Between Population and Sample
品質管理において、すべての製品を検査することは現実的ではありません。そこで重要になるのが「サンプリング」という考え方です。限られたデータから全体の姿を把握するための手法であり、QC検定3級でも頻出のテーマとなっています。ここでは、サンプリングの基本となる用語と考え方を解説します。
In quality control, inspecting every single product is not realistic. This is where the concept of “sampling” becomes essential. Sampling is a method for understanding the overall picture from a limited set of data, and it is a frequently tested theme in the QC Level 3 exam. This section explains the key terms and concepts that form the foundation of sampling.
母集団とは?サンプルとは?基本用語を押さえる What Is a Population? What Is a Sample? Mastering the Key Terms
サンプリングを理解するうえで、まず押さえておきたいのが「母集団」と「サンプル」という用語です。母集団とは、調べたい対象の集団全体のことを指します。たとえば、ある工場で1日に生産される製品すべてが母集団にあたります。
To understand sampling, the first terms to master are “population” (母集団) and “sample” (サンプル). A population refers to the entire group of subjects under investigation. For example, all products manufactured in a factory on a given day constitute the population.
しかし、生産されたすべての製品を検査するのは時間もコストもかかります。そこで、母集団の中から一部を抜き出して調べることになります。この抜き出されたデータのことを「サンプル」と呼びます。サンプルを測定し、得られたデータから母集団全体の姿を推定する。これがサンプリングの基本的な考え方です。
However, inspecting every product manufactured is time-consuming and costly. Instead, a portion is extracted from the population for examination. This extracted set of data is called a “sample.” Measuring the sample and using the resulting data to estimate the characteristics of the entire population — this is the fundamental concept of sampling.
サンプルの大きさが品質管理で重要な理由 Why Sample Size Matters in Quality Control
サンプルとして抜き出したデータの数のことを「サンプルの大きさ」といいます。この大きさは、母集団の姿をどれだけ正確に推定できるかに直結する重要な要素です。
The number of data points extracted as a sample is referred to as the “sample size.” This is a critical factor that directly determines how accurately the characteristics of the population can be estimated.
サンプルの大きさが小さすぎると、母集団全体の特徴を正しく捉えられない可能性が高まります。逆に、大きすぎると検査にかかる時間やコストが増大してしまいます。適切なサンプルの大きさを決めることは、品質管理の効率と精度を両立させるために欠かせない判断となります。
If the sample size is too small, there is a higher risk of failing to accurately capture the characteristics of the entire population. Conversely, if it is too large, the time and cost of inspection increase significantly. Determining an appropriate sample size is an essential decision for balancing efficiency and accuracy in quality control.
試験では、サンプルの大きさに関する基本的な理解を問う問題が出題されます。「サンプルの大きさ」という用語の意味を正確に覚えておきましょう。
The exam includes questions that test basic understanding of sample size. Make sure you have a precise understanding of what the term “sample size” means.

サンプリングの方法|ランダムサンプリングと有意サンプリング Sampling Methods | Random Sampling and Purposive Sampling
サンプルを抜き出す方法には、大きく分けて2つの種類があります。どちらの方法を選ぶかによって、得られるデータの性質が変わってきます。QC3では、それぞれの特徴と使い分けについて理解しておくことが求められます。以下の2つの方法について順番に見ていきましょう。
There are two main methods for extracting a sample. The choice of method affects the nature of the data obtained. QC Level 3 requires an understanding of the characteristics of each method and when to use which. Let us look at the following two methods in order.
- ランダムサンプリング(無作為抽出)
- 有意サンプリング(意図的抽出)
- Random Sampling (無作為抽出)
- Purposive Sampling (有意サンプリング / 意図的抽出)
ランダムサンプリング|無作為に選ぶ方法 Random Sampling | Selecting Without Bias
ランダムサンプリングとは、母集団を構成するすべての要素が同じような確率でサンプルとして選ばれるように抜き出す方法です。日本語では「無作為抽出」とも呼ばれます。くじ引きのように、どの製品が選ばれるかわからない状態で抽出するイメージです。
Random sampling is a method in which every element of the population has an equal probability of being selected as a sample. In Japanese, it is also referred to as 無作為抽出. Think of it like a lottery draw — the selection is made without knowing in advance which items will be chosen.
この方法の最大のメリットは、偏りのないデータが得られることにあります。特定の製品ばかりが選ばれることがないため、母集団全体の姿を正しく反映したサンプルを得ることができます。品質管理において母集団の姿を正しく捉えるためには、一般的にランダムサンプリングが用いられます。
The greatest advantage of this method is that it yields unbiased data. Since no particular product is disproportionately selected, the sample accurately reflects the characteristics of the entire population. Random sampling is the standard approach used in quality control when the goal is to accurately estimate the population.
有意サンプリング|意図的に選ぶ方法 Purposive Sampling | Selecting Intentionally
有意サンプリングとは、ランダムサンプリングとは異なり、意図的に特定の条件でサンプルを選ぶ方法です。たとえば、「夜に製造したものだけを調べる」「特定のラインで生産されたものだけを抜き出す」といったケースがこれにあたります。
Purposive sampling, unlike random sampling, involves intentionally selecting samples based on specific conditions. Examples include “inspecting only items manufactured at night” or “extracting only items produced on a specific line.”
この方法は、特定の条件下での品質を確認したい場合には有効です。しかし、母集団全体の姿を推定する目的には適していません。選び方に偏りがあるため、得られたデータが母集団を正しく代表しているとは限らないからです。
This method is effective when you want to assess quality under specific conditions. However, it is not suitable for estimating the characteristics of the population as a whole. Because the selection is biased, the data obtained does not necessarily represent the population accurately.
品質管理ではランダムサンプリングが基本 Random Sampling Is the Standard in Quality Control
母集団の姿を正しく捉えるためには、ランダムサンプリングを行うことが基本となります。試験でも「母集団の推定にはどちらの方法が適切か」という形で出題されることがあります。
Random sampling is the standard approach for accurately estimating the characteristics of a population. Exam questions may also be phrased as “which method is appropriate for estimating the population?”
ただし、現場では目的に応じて有意サンプリングを使う場面もあります。たとえば、特定の時間帯に問題が発生している疑いがある場合、その時間帯の製品だけを集中的に調べることは合理的な判断です。両方の方法の特徴を理解し、場面に応じて使い分ける考え方を身につけておきましょう。
That said, there are situations in real-world settings where purposive sampling is used depending on the objective. For example, if there is a suspicion that problems are occurring during a particular time period, focusing exclusively on products from that period is a rational approach. Develop the ability to understand the characteristics of both methods and apply them appropriately to different situations.
誤差の種類|「かたより」と「ばらつき」の違い Types of Error | The Difference Between Bias and Variation
サンプルを測定して得られたデータには、必ず誤差が含まれています。この誤差を正しく理解することは、品質管理において非常に重要です。QC3では、誤差の基本的な考え方として「かたより」と「ばらつき」の違いが問われます。それぞれの意味をしっかりと押さえておきましょう。
Data obtained by measuring a sample always contains error. Understanding this error correctly is extremely important in quality control. QC Level 3 tests the basic concept of error through the difference between “bias” (かたより) and “variation” (ばらつき). Make sure you have a solid grasp of what each term means.
真の値と誤差の関係を理解する Understanding the Relationship Between the True Value and Error
製品の重さを測定したとき、測定器に表示される値が本当に正しい値かどうかはわかりません。本当の値のことを「真の値」と呼びますが、実際に測定して得られる値は、この真の値とは異なる可能性があります。真の値と実際に得られた値の差のことを「誤差」といいます。
When measuring the weight of a product, we cannot know for certain whether the value displayed on the measuring instrument is truly correct. The correct value is called the “true value,” but the value actually obtained through measurement may differ from it. The difference between the true value and the value actually obtained is called “error.”
同じものを何回か測定したとき、毎回同じ値にならないことがあります。これは誤差が生じているためです。誤差がなぜ生じるのか、どのような種類があるのかを理解することが、正確なデータ分析の第一歩となります。
When the same object is measured multiple times, the values obtained are not always identical. This is because error is present. Understanding why error occurs and what types exist is the first step toward accurate data analysis.
かたより|平均値と真の値のズレ Bias | The Gap Between the Mean and the True Value
「かたより」とは、測定値の平均と真の値との差のことです。たとえば、100gの分銅を何度も測定したとき、平均値が102gになったとします。この場合、真の値である100gに対して2gの「かたより」があることになります。
“Bias” refers to the difference between the average of the measured values and the true value. For example, if a 100 g weight is measured repeatedly and the average comes out to 102 g, there is a bias of 2 g relative to the true value of 100 g.
かたよりは、測定器の校正がずれている場合や、測定方法に問題がある場合に生じやすくなります。一方向にずれた誤差であり、何度測定しても同じ方向にずれ続けるのが特徴です。かたよりを小さくするためには、測定器の調整や測定方法の見直しが必要となります。
Bias tends to occur when a measuring instrument is out of calibration or when there is a problem with the measurement method. It is a directional error — no matter how many times a measurement is taken, it consistently deviates in the same direction. Reducing bias requires adjusting the measuring instrument or reviewing the measurement method.
ばらつき|データのそろっていない度合い Variation | The Degree of Inconsistency in Data
「ばらつき」とは、測定値がそろっていない度合いのことです。同じものを何度も測定したとき、ある時は98g、ある時は103gというように値がばらばらになる現象を指します。
“Variation” refers to the degree of inconsistency among measured values. It describes the phenomenon where repeated measurements of the same object yield differing results — for example, 98 g on one occasion and 103 g on another.
ばらつきは、測定環境の微妙な変化や、測定者の技量の差などによって生じます。かたよりが一方向へのずれであるのに対し、ばらつきはプラス方向にもマイナス方向にもランダムに変動するのが特徴です。ばらつきを小さくするためには、測定条件を一定に保つことや、測定者の訓練などが有効となります。
Variation arises from subtle changes in the measurement environment or differences in the skill of the person taking the measurement. Unlike bias, which is a deviation in one consistent direction, variation fluctuates randomly in both positive and negative directions. Reducing variation requires maintaining consistent measurement conditions and training the people carrying out measurements.
試験では、かたよりとばらつきの違いを図で示して判断させる問題が出ることがあります。平均値のずれが「かたより」、値の散らばり具合が「ばらつき」と覚えておきましょう。
The exam may present a diagram showing the difference between bias and variation and ask you to identify each. Remember: the deviation of the average from the true value is “bias,” and the spread of values is “variation.”
サンプリング誤差と測定誤差|2つの誤差を区別しよう Sampling Error and Measurement Error | Distinguishing Between the Two Types of Error
サンプルを測定して得られたデータには、複数の種類の誤差が含まれています。QC3では、「サンプリング誤差」と「測定誤差」という2つの誤差について理解しておく必要があります。それぞれがどのような場面で生じるのかを整理していきましょう。
Data obtained by measuring a sample contains multiple types of error. QC Level 3 requires an understanding of two types: “sampling error” and “measurement error.” Let us organize when each type of error occurs.
サンプリング誤差|母集団の姿を推定するときに生じる Sampling Error | Arising When Estimating the Population
サンプリング誤差とは、サンプルから母集団の姿を推定するときに生じる誤差のことです。母集団全体を調べるのではなく、一部のサンプルだけを調べているため、どうしても誤差が発生します。
“Sampling error” refers to the error that arises when estimating the characteristics of a population from a sample. Because only a portion of the population is being examined rather than the whole, some degree of error is inevitable.
たとえば、母集団全体の平均が100gだったとしても、抜き出したサンプルの平均が98gや102gになることがあります。これは、たまたま軽いものや重いものが多く選ばれてしまったために生じる誤差です。サンプリング誤差は、サンプルの大きさを増やすことである程度小さくすることができます。
For example, even if the average of the entire population is 100 g, the average of the extracted sample may come out to 98 g or 102 g. This error arises because lighter or heavier items happened to be selected in greater numbers. Sampling error can be reduced to some extent by increasing the sample size.
測定誤差|測定値と真の値の間に生じる Measurement Error | Arising Between the Measured Value and the True Value
測定誤差とは、サンプルを実際に測定したときに生じる誤差のことです。同じものを何回か測定しても、毎回同じ値にならないことがあります。これは測定という行為自体に誤差が伴うためです。
“Measurement error” refers to the error that arises when a sample is actually measured. Even when the same object is measured multiple times, the values obtained may not be identical each time. This is because measurement inherently involves error.
測定誤差は、測定器の精度や測定環境、測定者の技量などによって左右されます。精密な測定器を使い、一定の条件下で測定を行うことで、測定誤差を小さく抑えることができます。
Measurement error is influenced by the precision of the measuring instrument, the measurement environment, and the skill of the person taking the measurement. Using a precise instrument and conducting measurements under consistent conditions will keep measurement error to a minimum.
どちらの誤差にも「かたより」と「ばらつき」がある Both Types of Error Contain Bias and Variation
重要なポイントとして、サンプリング誤差にも測定誤差にも、それぞれ「かたより」と「ばらつき」の両方が含まれています。つまり、誤差の種類は「サンプリング誤差か測定誤差か」という軸と、「かたよりかばらつきか」という軸の2つで整理することができます。
An important point to note is that both sampling error and measurement error each contain both “bias” and “variation.” In other words, types of error can be organized along two axes: “sampling error vs. measurement error” and “bias vs. variation.”
また、サンプリング誤差と測定誤差の大きさは、場合によって異なります。どちらが大きいかは状況次第であり、特に決まった大小関係はありません。試験では、この2つの誤差の違いと、それぞれにかたよりとばらつきがあることを理解しているかが問われます。
The magnitude of sampling error and measurement error also varies depending on the situation. Which is larger depends on the circumstances, and there is no fixed relationship between the two. The exam tests whether you understand the difference between these two types of error and that each contains both bias and variation.
まとめ|データとサンプリングの基礎を押さえて得点源にしよう Summary | Master the Fundamentals of Data and Sampling to Reliably Earn Points
本記事では、QC3で出題される「データの種類」と「サンプリング」について解説しました。最後に、試験対策として押さえておきたいポイントを整理しておきましょう。
This article has covered “types of data” and “sampling” as tested in QC Level 3. Let us conclude by organizing the key points to keep in mind for exam preparation.
データの種類については、まず「数値データ」と「言語データ」の違いを理解することが出発点です。さらに、数値データは「計量値」と「計数値」に分けられます。計量値は長さや重さのように連続的に変化する値、計数値は個数のように数え上げる値と覚えておきましょう。
For types of data, the starting point is understanding the difference between quantitative data and qualitative data. Quantitative data is further divided into variable data and attribute data. Remember: variable data consists of continuously changing values such as length or weight, while attribute data consists of counted values such as the number of items.
サンプリングについては、「母集団」「サンプル」「サンプルの大きさ」という基本用語を正確に理解することが大切です。母集団の姿を正しく推定するためには、ランダムサンプリングが基本となります。有意サンプリングとの違いも押さえておきましょう。
For sampling, it is important to have a precise understanding of the basic terms: “population,” “sample,” and “sample size.” Random sampling is the standard method for accurately estimating the characteristics of a population. Make sure you also understand the difference between random sampling and purposive sampling.
誤差については、「かたより」と「ばらつき」の違いが最重要ポイントです。かたよりは平均値と真の値のずれ、ばらつきはデータの散らばり具合を表します。また、誤差には「サンプリング誤差」と「測定誤差」の2種類があり、どちらにもかたよりとばらつきが含まれることを覚えておきましょう。
For error, the most important point is the difference between bias and variation. Bias represents the gap between the mean and the true value; variation represents the spread of data values. Also remember that there are two types of error — sampling error and measurement error — and that both contain bias and variation.
これらの基礎知識は、QC3の「品質管理の手法」分野で繰り返し出題されるテーマです。用語の意味を正確に理解し、図やイメージと結びつけて覚えることで、確実に得点できる分野となります。ぜひ本記事の内容を復習し、試験合格に向けた学習を進めてください。
These fundamental concepts are themes that appear repeatedly in the “Quality Control Methods” section of the QC Level 3 exam. By understanding the precise meaning of each term and committing it to memory alongside diagrams and mental images, this becomes a section where you can reliably earn points. Use this article as a review resource and keep building toward passing the exam.
練習問題 データとサンプリングの理解を確認しよう Practice Questions | Test Your Understanding of Data and Sampling
ここまで学んだ内容を確認するため、試験形式の練習問題に挑戦してみましょう。解答は各問題の下に記載しています。
To review what you have learned, try the following exam-style practice questions. The answer to each question is provided below it.
問題1 Question 1
次のデータのうち、計量値にあたるものはどれか。
Which of the following data items is an example of variable data?
- 1日に発生した不適合品の個数
The number of nonconforming items produced in a day - 製品の外径を測定した寸法(mm)
The outer diameter of a product measured in millimeters (mm) - 作業ミスの発生件数
The number of work errors that occurred - 検査で発見された傷の数
The number of scratches found during inspection
解答:2 Answer: 2
計量値とは、長さや重さなどのように連続的に変化する値のことです。製品の外径(mm)は測定器で計測する連続値であるため、計量値にあたります。選択肢1・3・4はいずれも「個数」や「件数」を数え上げた値であり、計数値に分類されます。「測定する=計量値」「数える=計数値」と覚えておきましょう。
Variable data refers to values that change continuously, such as length or weight. The outer diameter of a product measured in millimeters is a continuous value obtained by measurement, making it variable data. Options 1, 3, and 4 all represent values obtained by counting individual items or occurrences, and are therefore classified as attribute data. Remember: “measured = variable data” and “counted = attribute data.”
問題2 Question 2
サンプリングの方法に関する次の記述のうち、正しいものはどれか。
Which of the following statements about sampling methods is correct?
- 有意サンプリングは、母集団全体の姿を推定するために最も適した方法である。
Purposive sampling is the most appropriate method for estimating the characteristics of an entire population. - ランダムサンプリングとは、特定の条件を持つものだけを意図的に選ぶ方法である。
Random sampling is a method in which only items meeting specific conditions are intentionally selected. - ランダムサンプリングでは、すべての要素が同じような確率で選ばれるように抽出する。
In random sampling, all elements are selected so that each has an equal probability of being chosen. - サンプルの大きさを小さくするほど、母集団の姿を正確に推定できる。
The smaller the sample size, the more accurately the characteristics of the population can be estimated.
解答:3 Answer: 3
ランダムサンプリング(無作為抽出)は、母集団のすべての要素が同じような確率で選ばれるように抽出する方法であり、母集団全体の姿を正しく推定するための基本的な手法です。選択肢1は有意サンプリングの説明として誤りで、有意サンプリングは特定条件下の調査には有効ですが母集団全体の推定には適しません。選択肢2はランダムと有意の説明が逆です。選択肢4はサンプルの大きさが大きいほど精度が上がるため誤りです。
Random sampling (無作為抽出) is a method in which all elements of the population are extracted so that each has an equal probability of being selected. It is the standard approach for accurately estimating the characteristics of an entire population. Option 1 is incorrect as a description of purposive sampling: while purposive sampling is effective for investigating specific conditions, it is not suitable for estimating the population as a whole. Option 2 has the descriptions of random and purposive sampling reversed. Option 4 is incorrect because accuracy improves as sample size increases, not decreases.
問題3 Question 3
「かたより」と「ばらつき」に関する次の記述のうち、正しいものはどれか。
Which of the following statements about “bias” and “variation” is correct?
- かたよりとは、測定値の散らばり具合のことである。
Bias refers to the degree of scatter in measured values. - ばらつきとは、測定値の平均と真の値との差のことである。
Variation refers to the difference between the average of measured values and the true value. - かたよりは測定誤差にのみ含まれ、サンプリング誤差には含まれない。
Bias is contained only in measurement error and is not present in sampling error. - かたよりは平均値と真の値のズレ、ばらつきはデータの散らばり具合を表す。
Bias represents the gap between the mean and the true value; variation represents the degree of scatter in the data.
解答:4 Answer: 4
かたよりは「測定値の平均と真の値との差(一方向へのズレ)」、ばらつきは「データのそろっていない度合い(散らばり具合)」を表します。選択肢1と2は説明が逆になっています。選択肢3は誤りで、かたよりとばらつきはサンプリング誤差・測定誤差のどちらにも含まれます。この2軸で誤差を整理しておくことが試験対策のポイントです。
Bias represents “the difference between the average of measured values and the true value (a directional deviation),” while variation represents “the degree of inconsistency in data (the spread of values).” Options 1 and 2 have the descriptions reversed. Option 3 is incorrect: both bias and variation are present in both sampling error and measurement error. Organizing error along these two axes is the key point for exam preparation.
- 危険物乙4で覚えるべき「類別」とは?第1類〜第6類の特徴をわかりやすく解説 Hazardous Material Classification for the Class B Exam: Key Characteristics of Groups 1–6 Explained
- 第4類危険物の分類と引火点をわかりやすく解説 Class B, Group 4 Hazardous Materials Engineer | Classifications and Flash Points: A Complete Guide
この記事を書いた人
関連記事
-
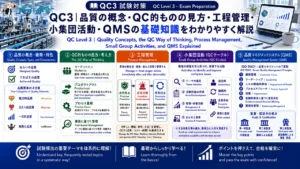
 QC3|品質の概念・QC的ものの見方・工程管理・小集団活動・QMSの基礎知識をわかりやすく解説 QC Level 3 | Quality Concepts, the QC Way of Thinking, Process Management, Small Group Activities, and QMS Explained
 -
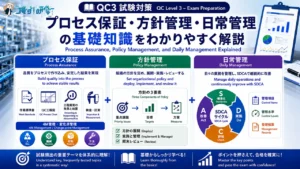
QC3|プロセス保証・方針管理・日常管理の基礎知識をわかりやすく解説 QC Level 3 | Process Assurance, Policy Management, and Daily Management Explained
-
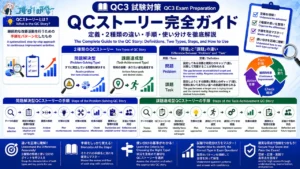
QC3|QCストーリー(問題解決型の8手順・課題達成型の9手順)の違いと使い分けをわかりやすく解説 QC Level 3 | QC Story: 8-Step Problem-Solving vs. 9-Step Task-Achievement Explained
-
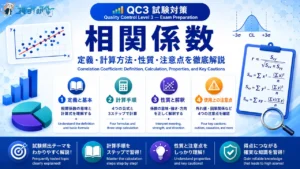
QC3|相関係数の計算方法・性質・使用上の注意点をわかりやすく解説 QC Level 3 | Correlation Coefficient: Calculation, Properties, and Key Cautions Explained
-
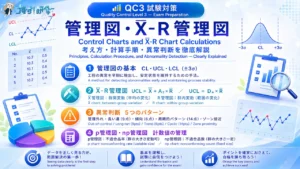
QC3|管理図の考え方とX̄-R管理図の計算方法をわかりやすく解説 QC Level 3 | Control Charts and X̄-R Chart Calculations Explained
-
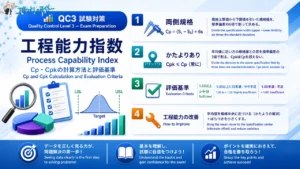
QC3|工程能力指数 Cp・Cpkの計算方法と評価基準 QC Level 3 | Process Capability Index: Cp and Cpk Calculation and Evaluation Criteria
-
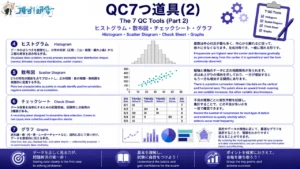
QC3|QC7つ道具(2) ヒストグラム・散布図・チェックシート・グラフの使い方 QC Level 3 | The 7 QC Tools (Part 2): How to Use Histograms, Scatter Diagrams, Check Sheets, and Graphs
-
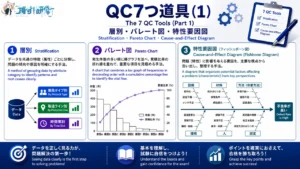
QC3|QC7つ道具(1)層別・パレート図・特性要因図の使い方 QC Level 3 | The 7 QC Tools (Part 1): How to Use Stratification, Pareto Charts, and Cause-and-Effect Diagrams