MENU
  • Top
  • Blog
  • About
    • Service
    • Profile
    • Contact
  • Our Solutions
    • Our Apps
    • Free Materials
  • 🌐 Language
    • العربية
    • Français
    • English
    • हिन्दी
    • Bahasa Indonesia
    • 한국어
    • မြန်မာ
    • नेपाली
    • Português (Brasil)
    • Tiếng Việt
    • 中文(简体)
    • 中文(繁體)
お問い合わせ
お問い合わせ
Supporting Your Learning Journey
Osuken Inc.
  • Top
  • Blog
  • About
    • Service
    • Profile
    • Contact
  • Our Solutions
    • Our Apps
    • Free Materials
  • 🌐 Language
    • العربية
    • Français
    • English
    • हिन्दी
    • Bahasa Indonesia
    • 한국어
    • မြန်မာ
    • नेपाली
    • Português (Brasil)
    • Tiếng Việt
    • 中文(简体)
    • 中文(繁體)
Contact
Osuken Inc.
  • Top
  • Blog
  • About
    • Service
    • Profile
    • Contact
  • Our Solutions
    • Our Apps
    • Free Materials
  • 🌐 Language
    • العربية
    • Français
    • English
    • हिन्दी
    • Bahasa Indonesia
    • 한국어
    • မြန်မာ
    • नेपाली
    • Português (Brasil)
    • Tiếng Việt
    • 中文(简体)
    • 中文(繁體)
  1. ホーム
  2. パレート図

パレート図– tag –

  • QC3試験対策 - QC7つ道具(1)を徹底解説 アイキャッチ画像
    QC3

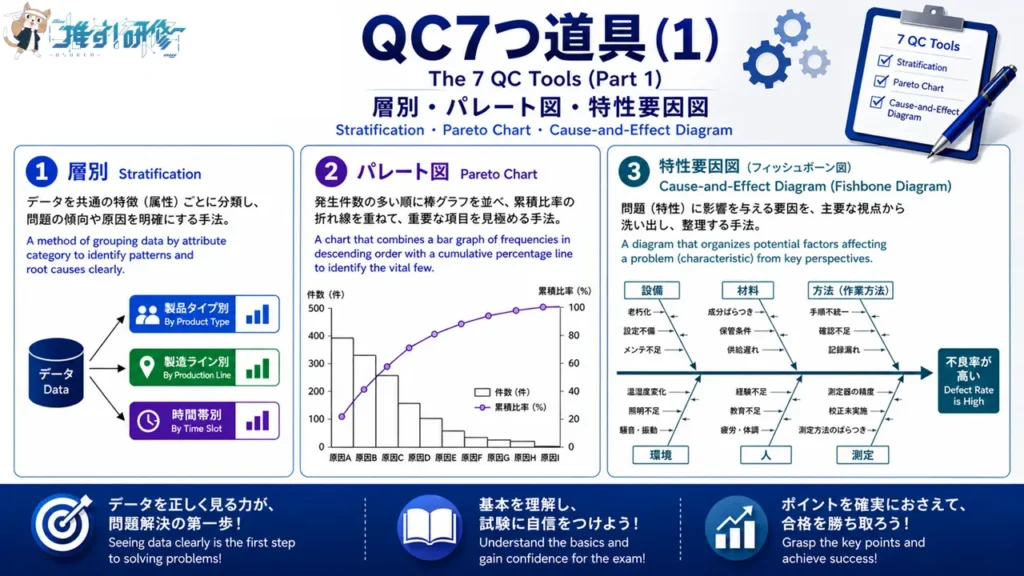
    QC3|QC7つ道具(1)層別・パレート図・特性要因図の使い方 QC Level 3 | The 7 QC Tools (Part 1): How to Use Stratification, Pareto Charts, and Cause-and-Effect Diagrams

    QC3の試験で必ず出題されるのが「QC7つ道具」です。これは製造現場で発生する問題を解決するための7つの基本ツールで、データを可視化し、原因を特定し、改善につなげるために欠かせません。 A topic that is guaranteed to appear on the QC Level 3 exam...
    2026年2月25日
1
  • Privacy Policy
  • Terms of Service
  • Notation Based on the Act on Specified Commercial Transactions

© 2025-2026 Osuken Inc.